Hi all
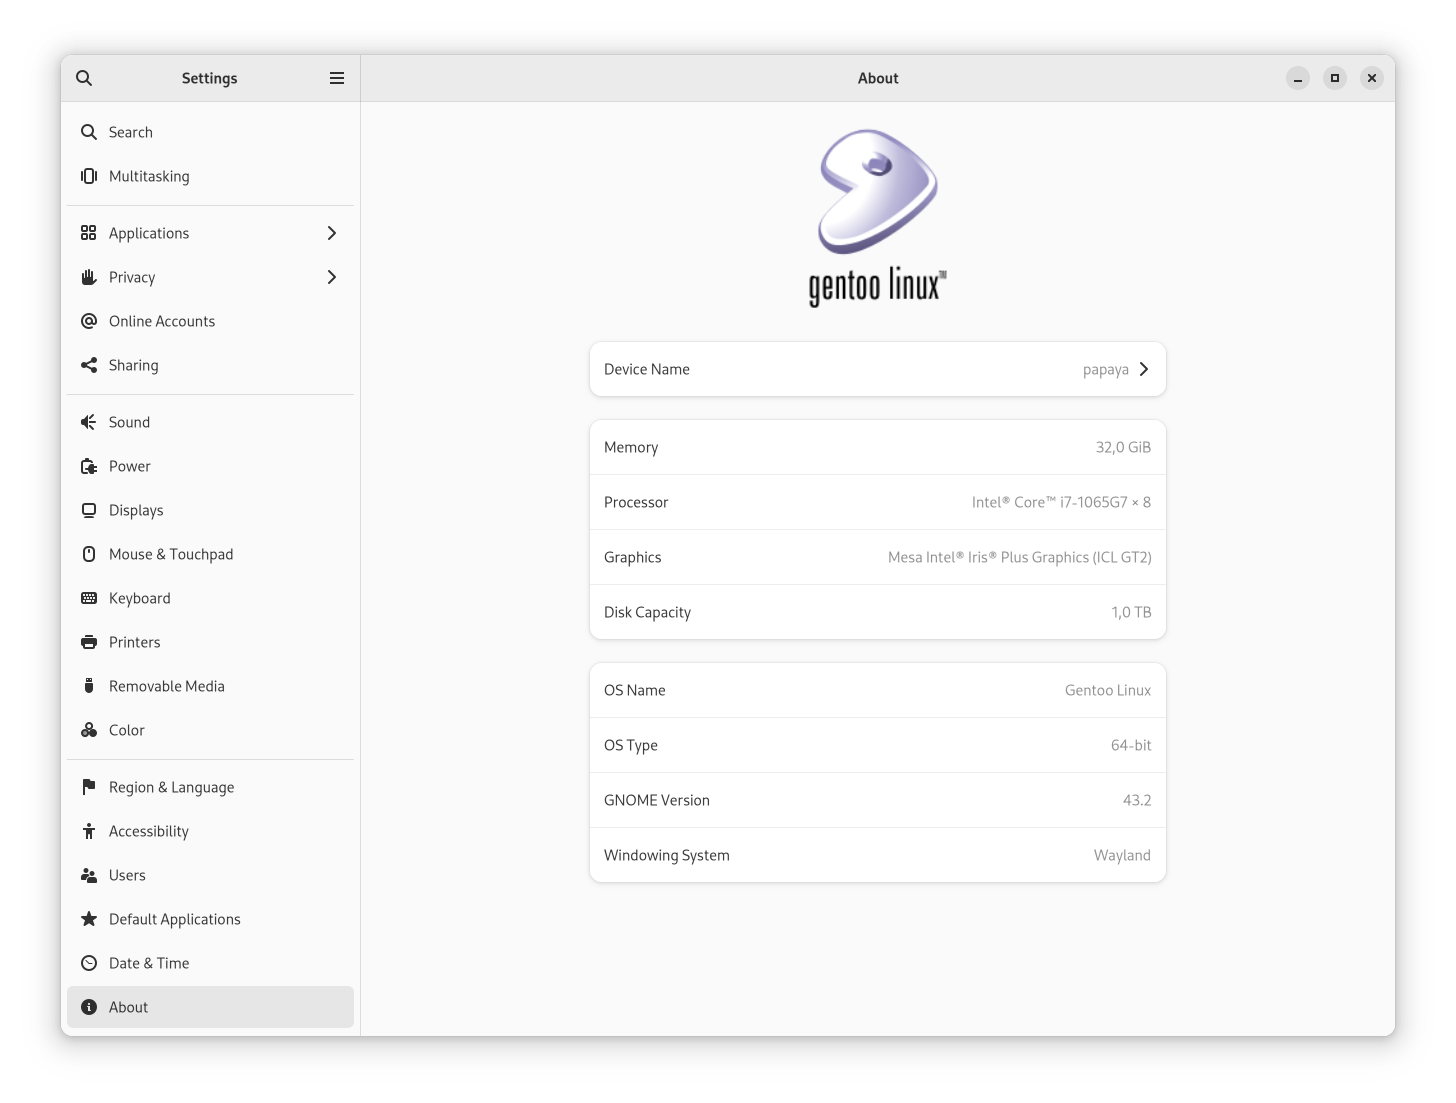
OS / Hardware context
$ [-] uname -a
Linux papaya 6.0.18-gentoo+ #73 SMP PREEMPT_DYNAMIC Tue Jan 10 10:42:01 EET 2023 x86_64 Intel(R) Core(TM) i7-1065G7 CPU @ 1.30GHz GenuineIntel GNU/Linux

$ [-] cat /etc/environment
LIBVA_DRIVER_NAME=iHD
MESA_LOADER_DRIVER_OVERRIDE=iris

$ [-] qlist -IU mesa
media-libs/mesa X abi_x86_64 cpu_flags_x86_sse2 gles2 proprietary-codecs video_cards_intel wayland zstd
x11-apps/mesa-progs X abi_x86_64 wayland
$ [-] gsettings get org.gnome.shell enabled-extensions
['battery_status@milliburn.github.com', 'ShellTile@emasab.it', 'audio-output-switcher@anduchs', 'audio-input-switcher@anduchs', 'GPaste@gnome-shell-extensions.gnome.org', 'syncthingicon@jay.strict@posteo.de', 'switcher@landau.fi', 'TopIcons@phocean.net', 'transparent-window@pbxqdown.github.com', 'places-menu@gnome-shell-extensions.gcampax.github.com', 'sound-output-device-chooser@kgshank.net', 'workspace-indicator@gnome-shell-extensions.gcampax.github.com', 'window-list@gnome-shell-extensions.gcampax.github.com', 'pomodoro@arun.codito.in', 'auto-move-windows@gnome-shell-extensions.gcampax.github.com', 'impatience@gfxmonk.net', 'noannoyance@daase.net', 'tophat@fflewddur.github.io']
Problem
In my software developer role, I admit, I load this workstation heavy, every day.
- Large displays (4k, 5k2k)
- Video calls through every day
- High heavy open app count (Firefox, Chrome, PhpStorm / IntelliJ (Java), Slack, Discord, Mattermost (lots of Electron); Terminal, Evolution (multiple windows) - 32G RAM was def. the right choice)
After a fresh login, everything is quite nice and smooth for a while, even after I load up majority of the workload apps.
But as days go by, Shell starts to become increasingly laggy.
- Cursor movement starts stuttering here and there, but does so consistently.
- All kinds of UI elements react slower.
htopshows gnome-shell consuming even 10% of memory (this is 3+GB here!) - signs of memory leaks.- I am aware running into swap can cause this, too - but I’m fairly certain this degraded experience is not only about active swapping operations, since such happens fairly rarely.
What can I do to retain the initial session smoothness longer?
What are some debug techniques I can use to provide more data here?